


Understanding the contents of your data, being able to visualize it, and eventually analyze is easier said than done.
Don’t worry; if what I described hits close to home, you’re not alone. A recent survey by NewVantage found that while 98.6 percent of Fortune 1000 companies are in the process of creating a data-driven culture, only 32.4 percent consider themselves fully data-driven.
It’s great to have ambitions about being data-driven. Businesses that leverage data inside and outside their organizations see business efficiencies, reduced operational costs, and are typically quicker to disruptive opportunities.
However, being data-driven is easier said than done. From consumer insight to supply chain management data, the amount of business-crucial data available today can be quite overwhelming.
As more businesses look to prepare themselves for the data-driven future, the use of business intelligence software is becoming more prevalent
What is business intelligence?
In its earliest days, business intelligence, also known as BI, wasn’t the most digitally savvy approach to interpreting data.
It often meant printing out lengthy sheets of metrics and key performance indicators (KPIs), like sales and churn numbers. While these printouts were helpful for managers and executives, they didn’t capture the full picture of an organization’s performance.
As more data was generated, especially outside an organization’s database, there was a drastic need for more intuitive ways to collect and visualize all this data. This is where business intelligence comes in.
What is the role of business intelligence?
Business intelligence refers to both tools and methodologies for becoming more data-driven. This is done through data aggregation, visualized in the form of dashboards, reports, graphs, and charts.
Business intelligence is a common tech buzzword, much like big data analytics, the internet of things, data mining, and others. While these technologies and processes all utilize data in some way, there are some notable distinctions that we’ll dive into later.
Regardless of which term you’re talking about, there’s always a purpose for applying data-driven insights.
Before real value can be extracted from the data, each business needs to establish a data management process ahead of time.
| TIP: Learn how organizations are becoming more analytical with data-driven marketing. |
Data Management
Much like hosting Thanksgiving dinner, there’s a serious amount of prep that goes into managing vast amounts and varieties of business-crucial data. As a matter of fact, nearly 40 percent of data professionals spend more than 20 hours per week sifting through and prepping data, rather than analyzing it.
The prep, while tedious, is a necessary first step for creating that coveted data-driven culture. This is what is called data management.
There are many facets to data management. The first step involves collecting tons of data from internal sources, such as CRM software, ERP systems, cloud computing services, and more. Data from external sources, like market data or social networks, may be collected as well.
After all this data is collected, the real time-consuming process takes place. Data needs to be standardized and organized in a way that’s easier for business intelligence tools to look at. Everything will be eventually stored in a data warehouse, or a central place, for data to be quickly accessed.
The data management process should be looked at as a cycle, rather than a linear set of tasks. Not all data is perfect or even relevant to a business's bottom line. Corrupted and duplicate data always seems to find new ways to creep back in. Data management ensures the best-fit data is being pulled and analyzed.
Want to learn more about Embedded Business Intelligence Software? Explore Embedded Business Intelligence products.
Business Intelligence Tools
With all that data standardized and in one place, it’s time to run it through a business intelligence tool.
There are a variety of tools available today, and each tool has its own unique way for analyzing data. For example, some BI tools might include ad hoc analytics, which basically means the user has to pull their own results. Other BI tools may utilize real-time analytics or enterprise reporting.
With the data analyzed, each BI tool will need to visualize the results for analysts and researchers to examine. A common way is through descriptive or diagnostic analyses in the form of graphs, charts, and other reports. These analyses provide a general overview of what happened at a particular point in the past, and why it happened.
An increasingly popular way to visualize BI data is through self-service dashboards and performance scorecards. These tools make the data more readable for managers, executives, and general business users.
Advanced analytics in the form of predictive, prescriptive, and big data analytics may be incorporated as well. These analyses, however, are extremely complex and require a high-level of artificial intelligence (AI) and machine learning.
The use of advanced analytics isn’t commonplace. They’re not only expensive to generate, but highly-skilled data scientists are often needed to make sense of them.
Finding the Business Value
We’re not analyzing data just for the fun of it. Real value will need to be extracted from the reports, charts, dashboards, and other visualizations that are provided. This is, after all, the ultimate purpose of business intelligence.
While KPIs and other business-relevant metrics will obviously be looked at, the value itself will differ from one business to another.
For example, a marketing firm might utilize business intelligence to narrow down demographics and target the right audiences with its campaigns.
Those working in sales could use business intelligence to identify and focus on higher-profit customers – and no, this doesn’t always mean focusing on the “bigger fish.”
From an executive level, BI data can act as a single source of truth, or SSOT, for your business. When all relevant data is pointing in the same direction, those crucial business decisions can officially be labeled as “data-driven.”

BI and Big Data
Business intelligence and big data are some of the most common tech terms you’ll read about on the Internet today. While one might be compelled to use the two interchangeably, the differences are quite stark.
Big data is simply “big” amounts and varieties of data and the speed at which the digital universe is expanding. Big data is everything from emails and text messages to voicemails and YouTube videos. It is every form of structured, unstructured, and semi-structured data.
About 80 percent of the world’s data is considered unstructured, a type of data that doesn’t fit well within fixed fields or relational databases. Because unstructured data is difficult for conventional analytics programs to digest, big data processing software and analytics are used to find value.
On the other hand, business intelligence deals with mostly structured data. This type of data is highly organized (think of data that would fit well within a spreadsheet), so that it can be quickly pulled for analysis.
The two terms, while different, do intersect at some points. Both big data analytics and BI tools have the capabilities to generate descriptive and diagnostic reports. Descriptive tells us what happened and diagnostic tells us why it happened.
When we begin moving toward predictive and prescriptive analyses, which involve AI and machine learning, this is where most BI tools break off.
BI and big data analytics are both used for finding efficiencies, customer insights, new product opportunities, and more. However, the scale of the two are just different.
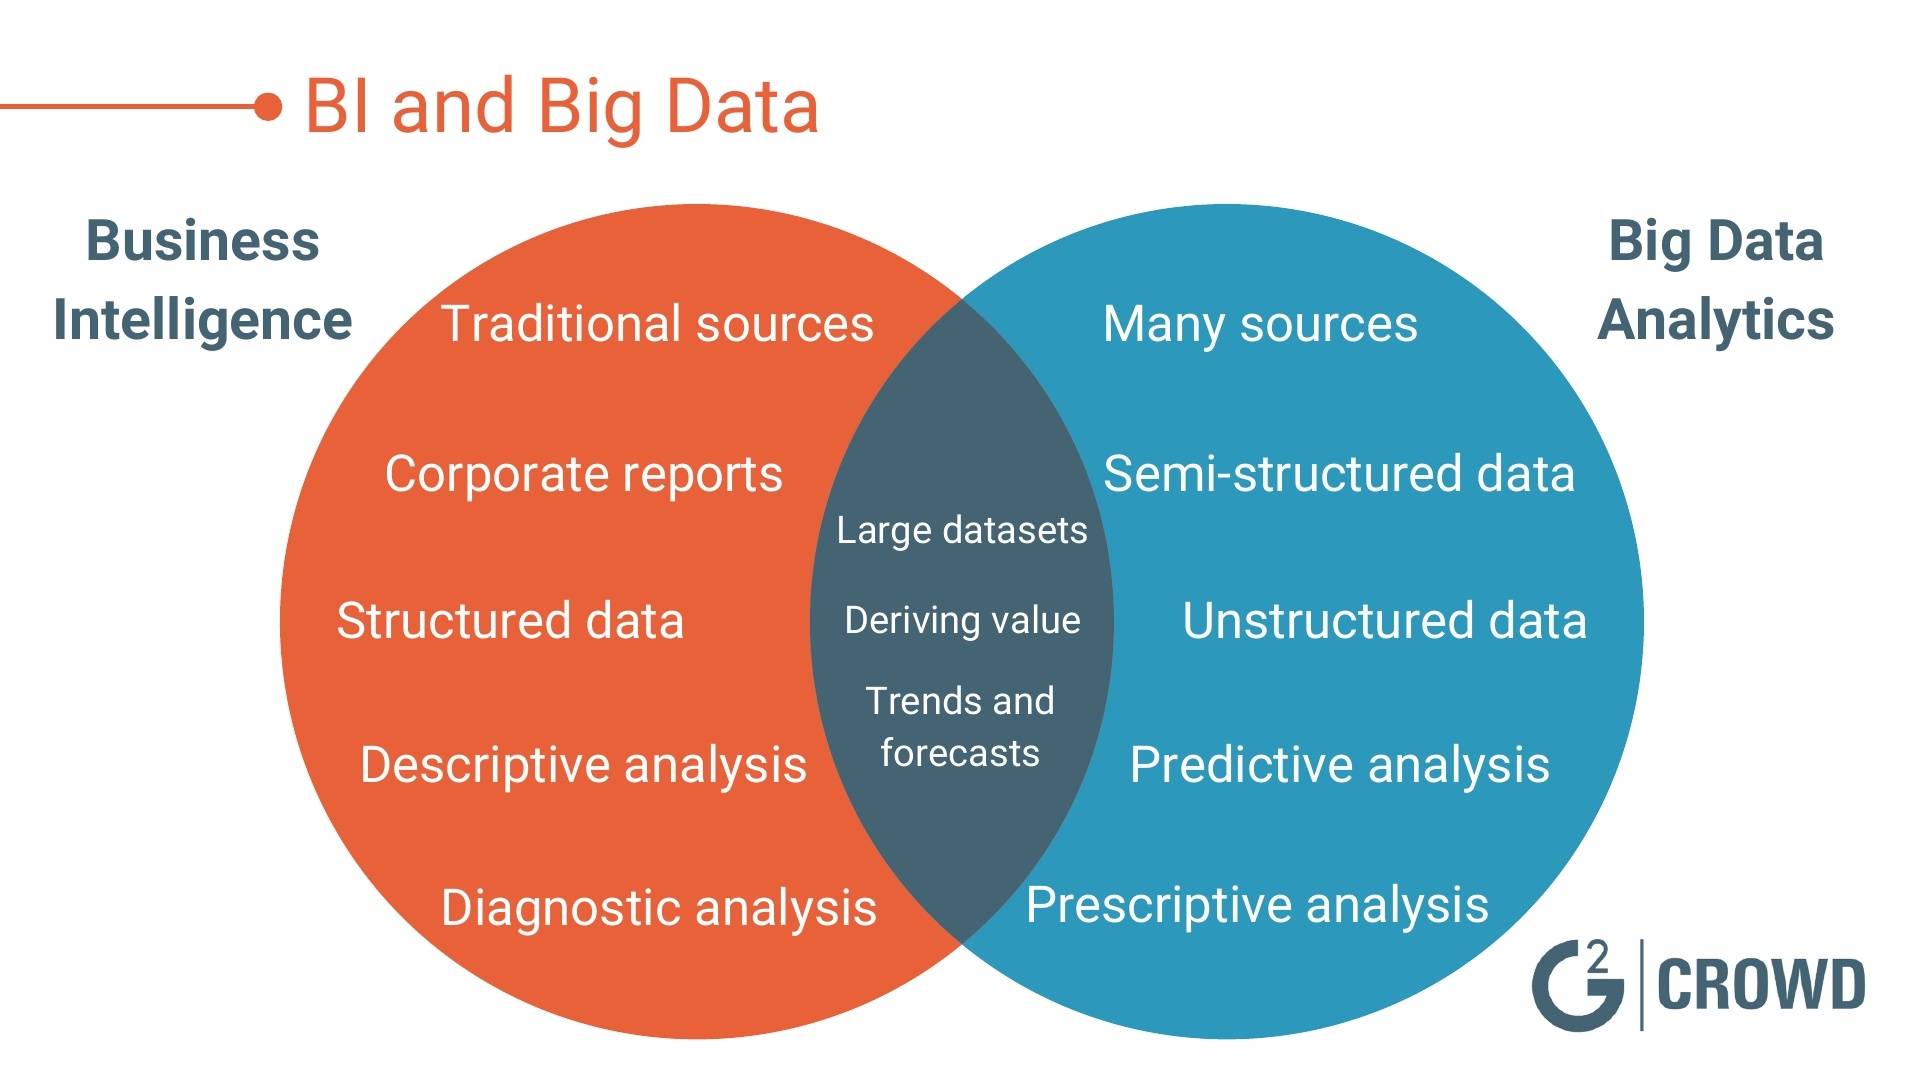
If I could visualize this difference, it’d be like fishing in a lake versus fishing in an ocean. Both are after the same outcome, but the tools used throughout the journey and the scale of the journey itself will differ.
BI and Data Mining
Data mining is another tech term you might run into when reading about businesses and the ways they’re using their data. Business intelligence and data mining are often jumbled together, but the two have their own distinctions.
We’ve established that the terms data-driven and business intelligence pretty much go hand-in-hand. Being driven by data means BI allows end-users to visualize performance through KPIs, dashboards, scorecards, and more. Data mining, however, will dive into a particular KPI or metric.
BI tools process fairly large sets of business-related data while data mining sifts through generally smaller sets. Because data mining is a scientific and mathematical approach to interpreting data, BI tools are much more approachable for managers and executives without algorithmic knowledge.
Data mining is defined as “knowledge discovery within an organization’s database.” The results of data mining can be tested quickly and new KPIs or metrics might be generated as well.
Both BI and data mining help businesses become smarter and more calculated. Decision makers can make use of insight from the two, addressing pain points and finding new business opportunities.

Business Intelligence Examples
Businesses across many industries are utilizing BI software to collect and process massive amounts of data. Because each industry has its own benchmark for success, the way this data is visualized and applied varies greatly. Let’s look at some industries and the ways businesses are turning data into actionable results.
Healthcare
As of recent, the healthcare industry has welcomed the use of data with open arms. In a PwC survey, 95 percent of healthcare CEOs agreed that harnessing more data would unveil new ways to address industry pain points.
One of the most prominent pain points in healthcare is figuring out how to manage mountains of internal data. From sensitive patient data to diagnosis and procedure data, the healthcare industry can benefit greatly from BI dashboards that consolidate everything in one place.
By organizing data in more efficient ways, business intelligence could lead to better patient outcomes, lower readmission rates, and higher quality care.
Manufacturing
For manufacturing to be successful, a factory’s output needs to be as high as possible while still being efficient – essentially the best of both worlds. Through the use of business intelligence, floor shop managers can leverage BI data to maintain a well-oiled machine and reduce operational costs.
Here’s a mockup dashboard to visualize the types of reports that are commonly generated in manufacturing.

Tracking real-time data, like inventory management and supply chain, is extremely useful in manufacturing. Running these analyses on a regular basis can provide insight on customer preferences, order fulfillment rates, and production cycles.
Finance
Since the 2008 financial crisis, new regulations and compliances have been put in place to identify, minimize, and manage risk.
BI tools have and will continue to be used for examining credit portfolios, customer loans, and delinquency cases in a proactive way. Don’t worry if you’re not caught up on all this finance jargon. All you need to know is business intelligence is allowing for a more sustainable financial landscape.
In order to stay compliant with the fast-changing legislation created for the finance industry, many companies are employing the help of software to help them stay compliant.
Programs like our own G2 Track provide an easy way for companies to manage vendors, consolidate financial data, and increase SAAS ROI with our integrations and partnerships program. G2 Track also allows you to manage all of your software contracts and spending in one place with out software discovery tool.
|
Learn more about how you can manage software spend, usage, contracts, and compliance -- and optimize your entire tech stack with G2 Track.
|
The Road Ahead for Business Intelligence
BI software has certainly led to more agile decision making and helped businesses achieve the data-driven cultures they’ve been after. While the benefits of business intelligence are undeniable, there are still a few obstacles BI must overcome in the near future to maintain its relevance.
Self-service
The first obstacle is creating more effective self-service BI software. Data science is necessary, but also difficult for many businesses to grasp.
Self-service tools relieve pressure off IT departments by allowing managers and executives to make sense of relevant data.
This isn’t to say data scientists need to be fully bypassed. But the more educated business users are about their data, the better the outcome for their businesses.
Advanced analytics
Another obstacle that conventional BI tools will need to overcome is adopting more advanced analytics – and you can thank big data for this one.
Data outside an organization is proven to be extremely valuable, but it’s also hard to apply without advanced analytics. While reports give a great birds-eye view of an organization’s past performance, things like predictive and prescriptive analytics are where the future lies.
Voice search and AI
The future of BI reporting will be voice search-friendly and incorporate decision support digital assistants, or DSDA. ComScore estimates that by 2020, half of all search engine queries will be conducted by voice. In the U.S. alone, there will be 67 million voice-assisted devices regularly used by next year.
If you think that AI assistants like Alexa and Cortana are reserved for the B2C market, think again. DSDA will change the way managers and executives receive their reports and KPI breakdowns from business intelligence tools.
With advances in natural language processing software and machine learning software, results from voice searches will only get more accurate. For now, the reason why voice search is preferred is because it’s fast and eliminates typing and reading.
Wrapping up Business Intelligence
In a world that is becoming increasingly driven by data, few businesses can afford to not adopt a data-driven culture in the near future.
You can begin molding this culture by establishing a data management process – which ensures all data being collected is relevant to your business. Running this data through business intelligence tools helps visualize past pain points and may point toward possible solutions in the future.
The road ahead for business intelligence is bright. As BI tools become more equipped to handle big data, more business users will gain an understanding of their metrics and be able to craft unique solutions that drive profits and satisfy customers.
Interested in learning more? Check out these 30 business intelligence statistics for data-driven companies.

Devin Pickell
Devin is a former senior content specialist at G2. Prior to G2, he helped scale early-stage startups out of Chicago's booming tech scene. Outside of work, he enjoys watching his beloved Cubs, playing baseball, and gaming. (he/him/his)

